

How are 'data of interest' such as capacity, Coulombic efficiency and dQ/dV calculated automatically?
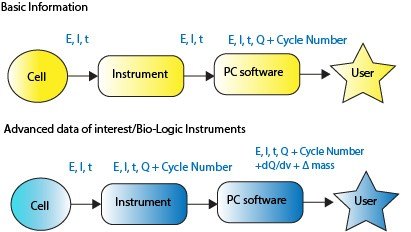
The variable process functions of EC-Lab and BT-Lab calculate values such as capacity, Coulombic efficiency, energy, dQ/dV and ohmic drop from time, current and voltage, online or in post-processing.
Key points
- Values calculated in the software depend on the sampling rate chosen by the user; values calculated in the instrument depend only on its time base (200 µs on Essential and Premium potentiostats) and are therefore more accurate.
- Because the instrument runs autonomously, safety and experimental limits are triggered even if the computer or the communication fails.
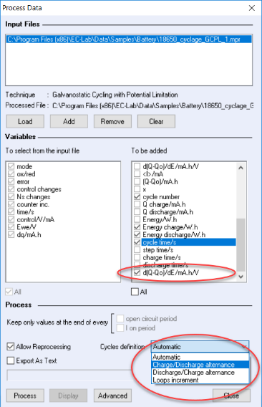
- Calculated variables: Q-Q0, Qcharge and Qdischarge reset every cycle, efficiency (Qdischarge/Qcharge), normalised charge x, dQ/dV, ohmic-drop compensation, cycle number, power (E·I) and energy (E·I·t) in CPW, Echarge and Edischarge.
- Automatic variables are passed to the next technique as limits or parameters; non-automatic ones are for analysis. Variables are added in the Process Data window, where the cycle definition (charge/discharge or discharge/charge order, loop increment) is chosen.
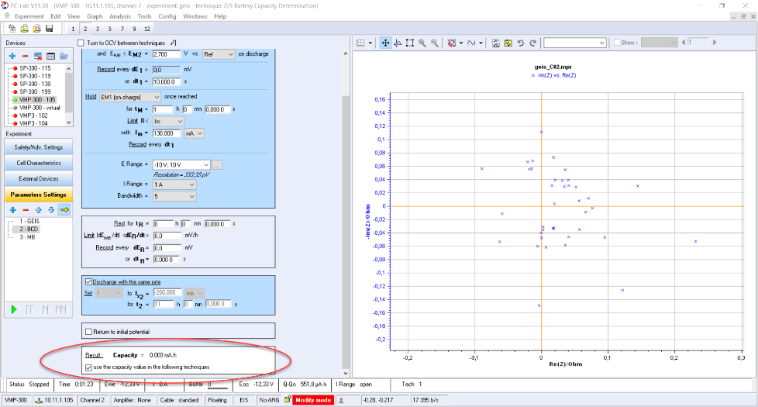
- BCD (battery capacity determination) finds the actual capacity by galvanostatic discharge; the next technique uses it to calculate automatically the current for the desired C-rate. This increases precision in tests of thousands of cycles.
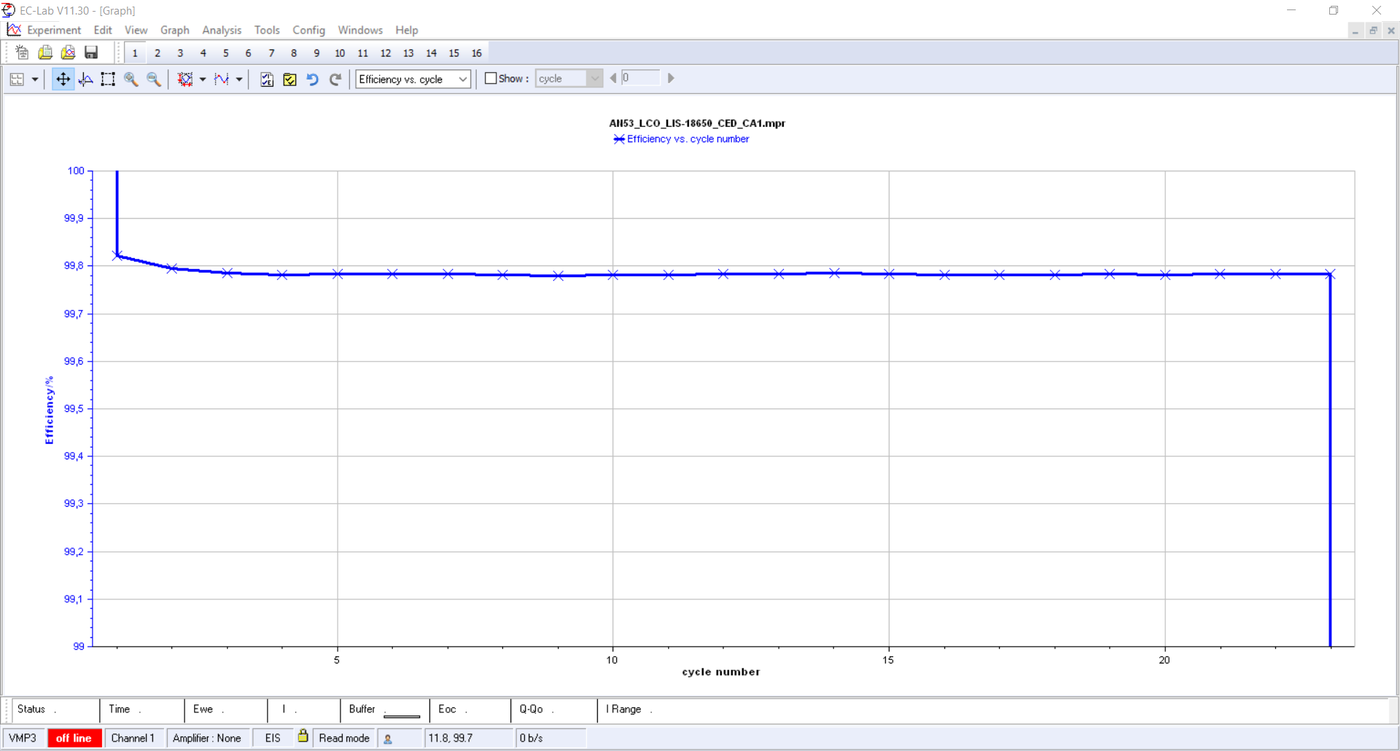
- Coulombic efficiency is calculated automatically and plotted against cycle number; the same tools serve silicon-anode batteries, capacity fade, ohmic drop and dQ/dV analysis.
Figures
Images: Bio-Logic Science Instruments; taken from the source article.
Related application notes
Related curriculum module: Battery Testing and Characterisation
Related products:BCS-900 Series (BCS-905 / 910 / 915)MPG-200 Series (MPG-2 / MPG-205)BT-Lab® SuiteEC-Lab®
Source: Bio-Logic Learning Center, “Data of interest – work more efficiently.” · Source updated: November 18, 2024
Copyright of the images and the original text belongs to Bio-Logic SAS.
Copyright of the images and the original text belongs to Bio-Logic SAS.