

How is the EIS accuracy contour plot used to plan a measurement?
The accuracy contour supplied with each potentiostat shows which frequencies can be measured within a stated modulus and phase error for a given impedance range.
Key points
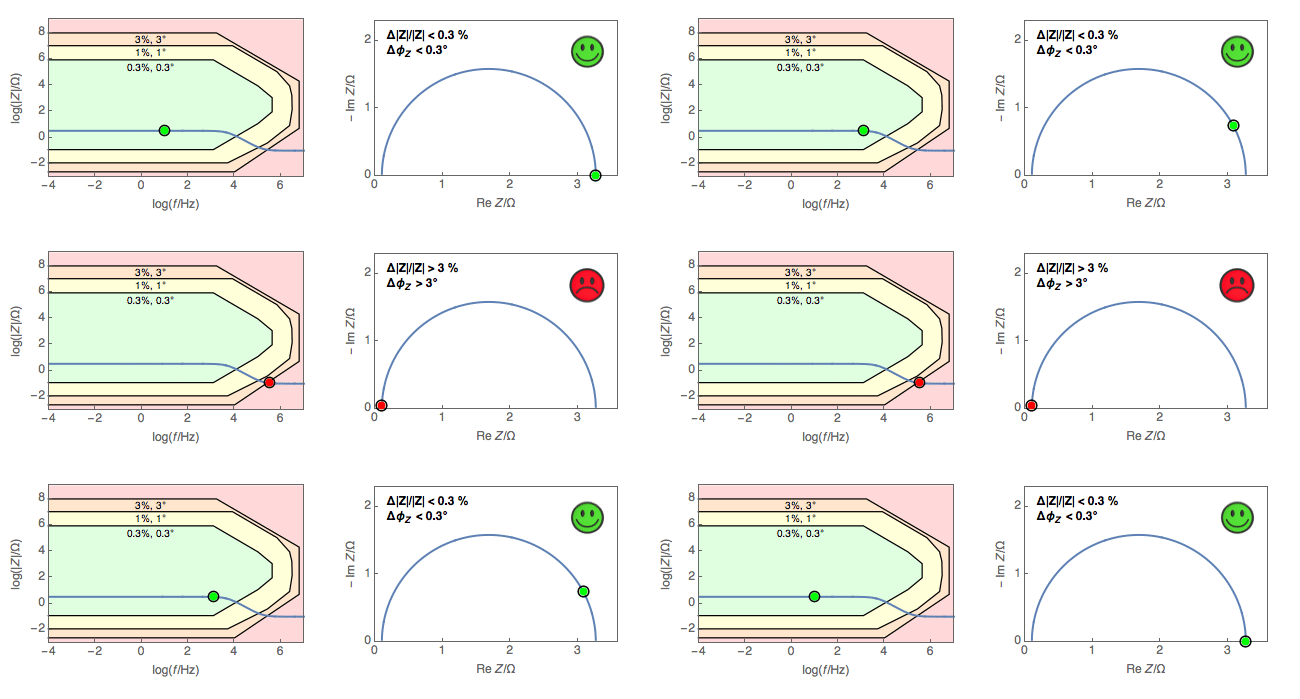
- The coloured areas show |Z| (%) and phase (°) error bands as a function of impedance modulus and frequency; in the example the error is below 0.3% and 0.3° in the innermost area and rises to 1% / 1° and 3% / 3° in the outer bands.
- When the Bode modulus curve of a circuit (e.g. R1 + R2/C2) is drawn over the contour, the band of each frequency point can be read; points outside the bands also appear wrong in the Nyquist plot.
- The contour is valid only for the stated conditions (excitation amplitude, temperature, averaging, etc.) and is an image of the instrument's capability; cables and accessories must also be taken into account.
- Details of how to read it are in Bio-Logic AN54.
Figures
Images: Bio-Logic Science Instruments; taken from the source article.
Related application notes
Related curriculum module: Electrochemical Impedance Spectroscopy (EIS)
Source: Bio-Logic Learning Center, “How to use electrochemical impedance spectroscopy (EIS) accuracy contour plots” · Source updated: November 18, 2024
Copyright of the images and the original text belongs to Bio-Logic SAS.
Copyright of the images and the original text belongs to Bio-Logic SAS.