
Why does a low-conductivity electrolyte give better images in SVET and LEIS?
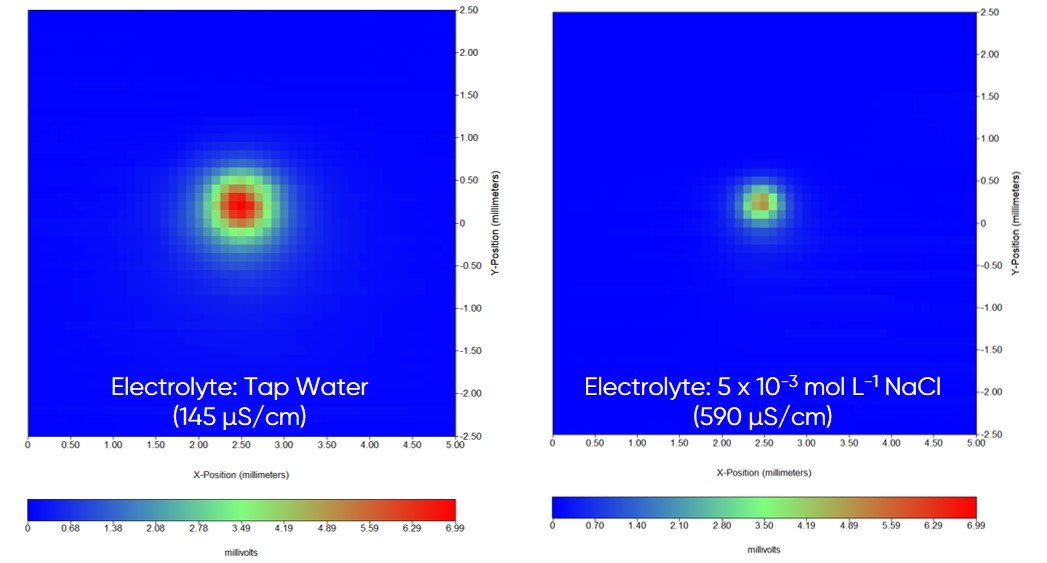
Both techniques measure the potential gradient above the sample, and this gradient is inversely proportional to electrolyte conductivity. Comparative SVET and LEIS maps in tap water and dilute NaCl.
Key points
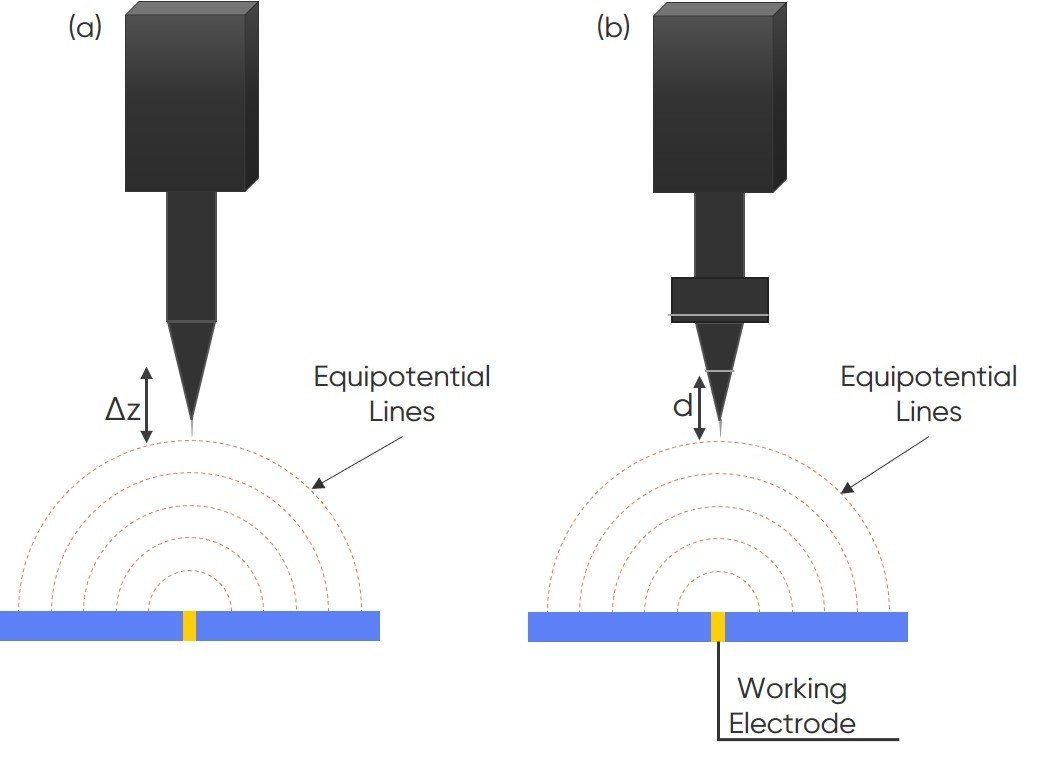
- For a point source the potential at the probe is φ = I/(2πκR), where κ is the solution conductivity and R the distance from the source. As conductivity increases the gradient and the signal weaken; simulations show that low conductivity also improves the localisation of features.
- If a high-conductivity electrolyte must be used, the signal can be increased by moving the probe closer to the sample, although this is not always possible.
- Conductivity is assumed constant throughout the measurements; evaporation increases it and leaves the calibration valid only at the start. A large-volume cell such as the TriCell is a simple precaution.
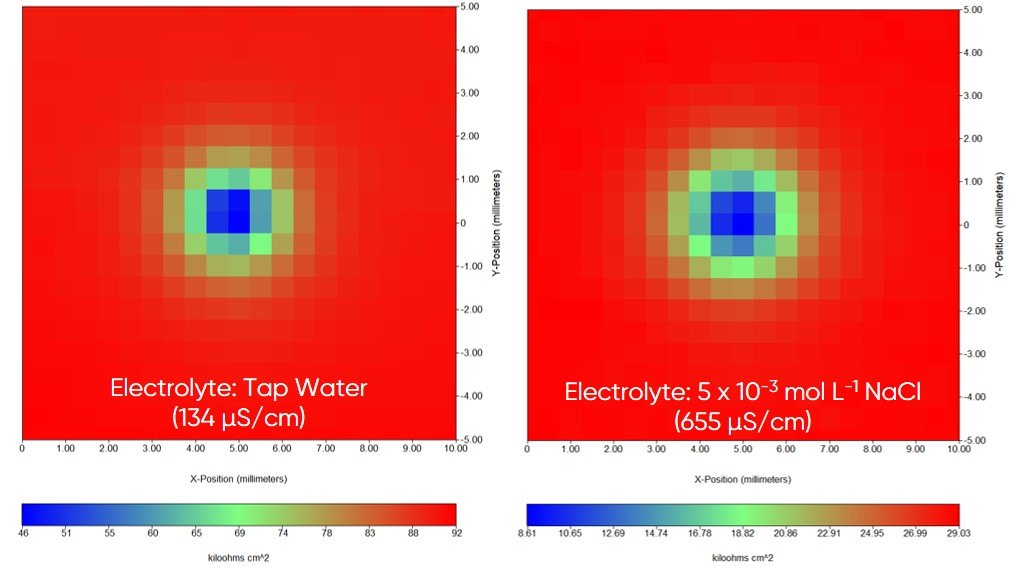
- In LEIS conductivity also affects the usable frequency range: low conductivity improves the resolution of the ac current, high conductivity reduces the effect of stray capacitance at high frequency.
- Conductivity can be determined from the ohmic resistance fitted from EIS instead of a conductivity meter.
- Examples: SVET in tap water (145 µS/cm) and 5 mM NaCl (590 µS/cm); LEIS at 134 µS/cm and 655 µS/cm. At low conductivity the signal is stronger and the contrast clearer.
Figures
Images: Bio-Logic Science Instruments; taken from the source article.
Related application notes
- Vibrating-probe measurements on plants with the SVP470 Scanning Probes AN22
- Ohmic drop 2: Which techniques measure IR drop? Battery AN28
Related curriculum module: Electrochemical Impedance Spectroscopy (EIS)
Related products:M470
Source: Bio-Logic Learning Center, “Better image resolution in SVET and LEIS using low conductivity electrolyte” · Source updated: May 27, 2025
Copyright of the images and the original text belongs to Bio-Logic SAS.
Copyright of the images and the original text belongs to Bio-Logic SAS.