

How is high-quality EIS data collected for training AI models?
Machine-learning models are only as good as the data they are fed. The four conditions of a valid EIS dataset, what to check before adding data to a dataset, the strengths and weaknesses of validation methods, and equivalent-circuit selection.
Key points
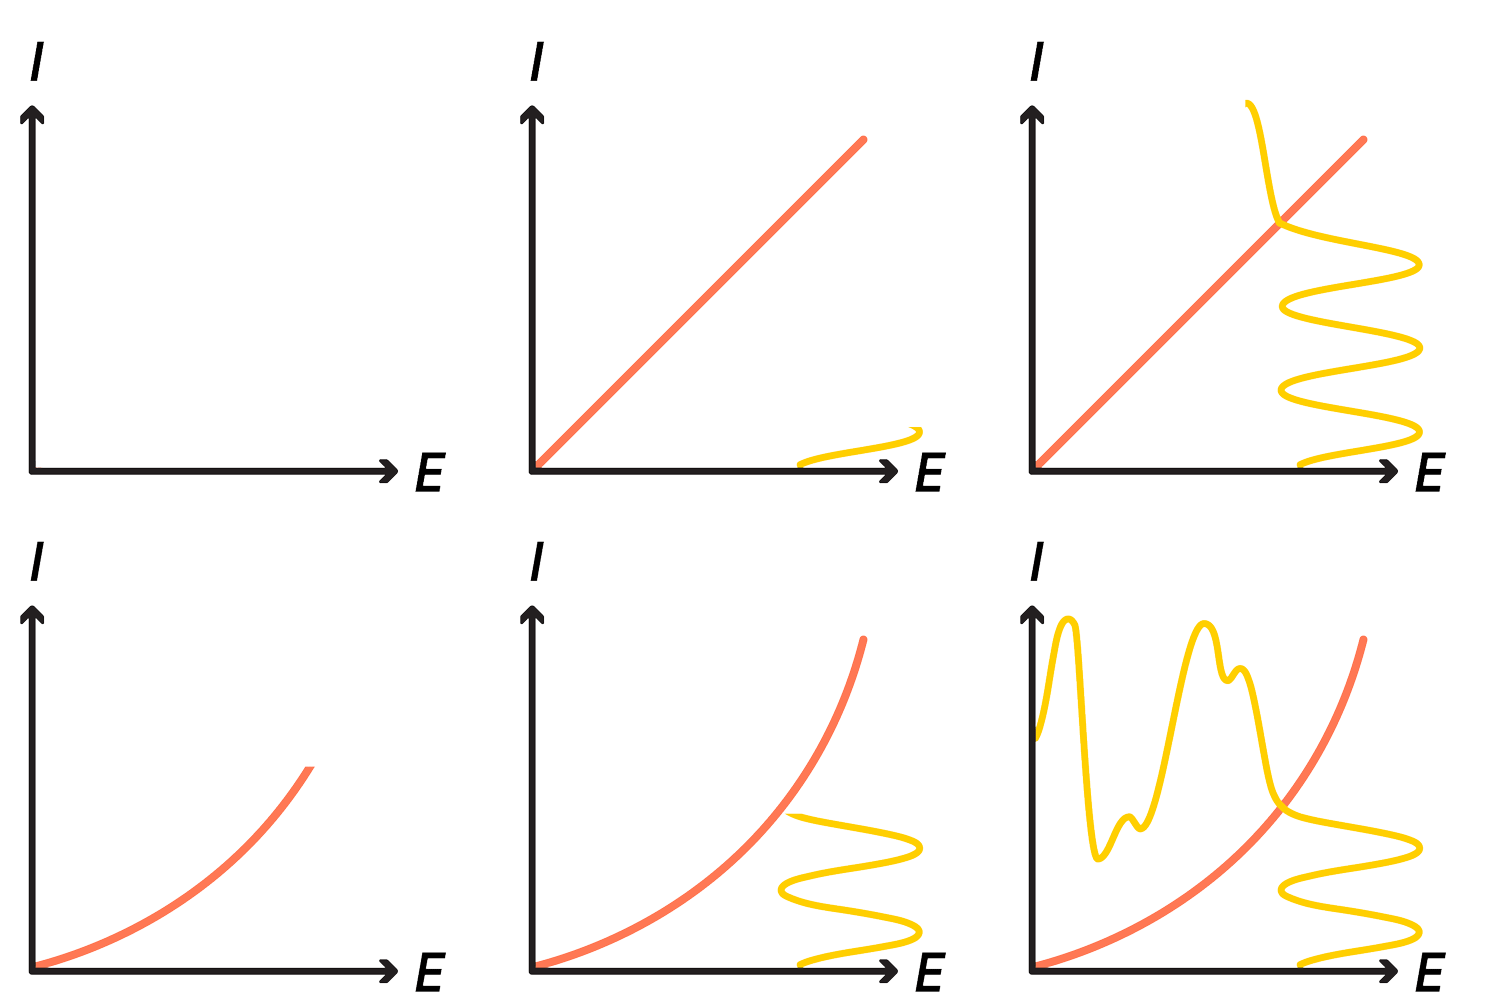
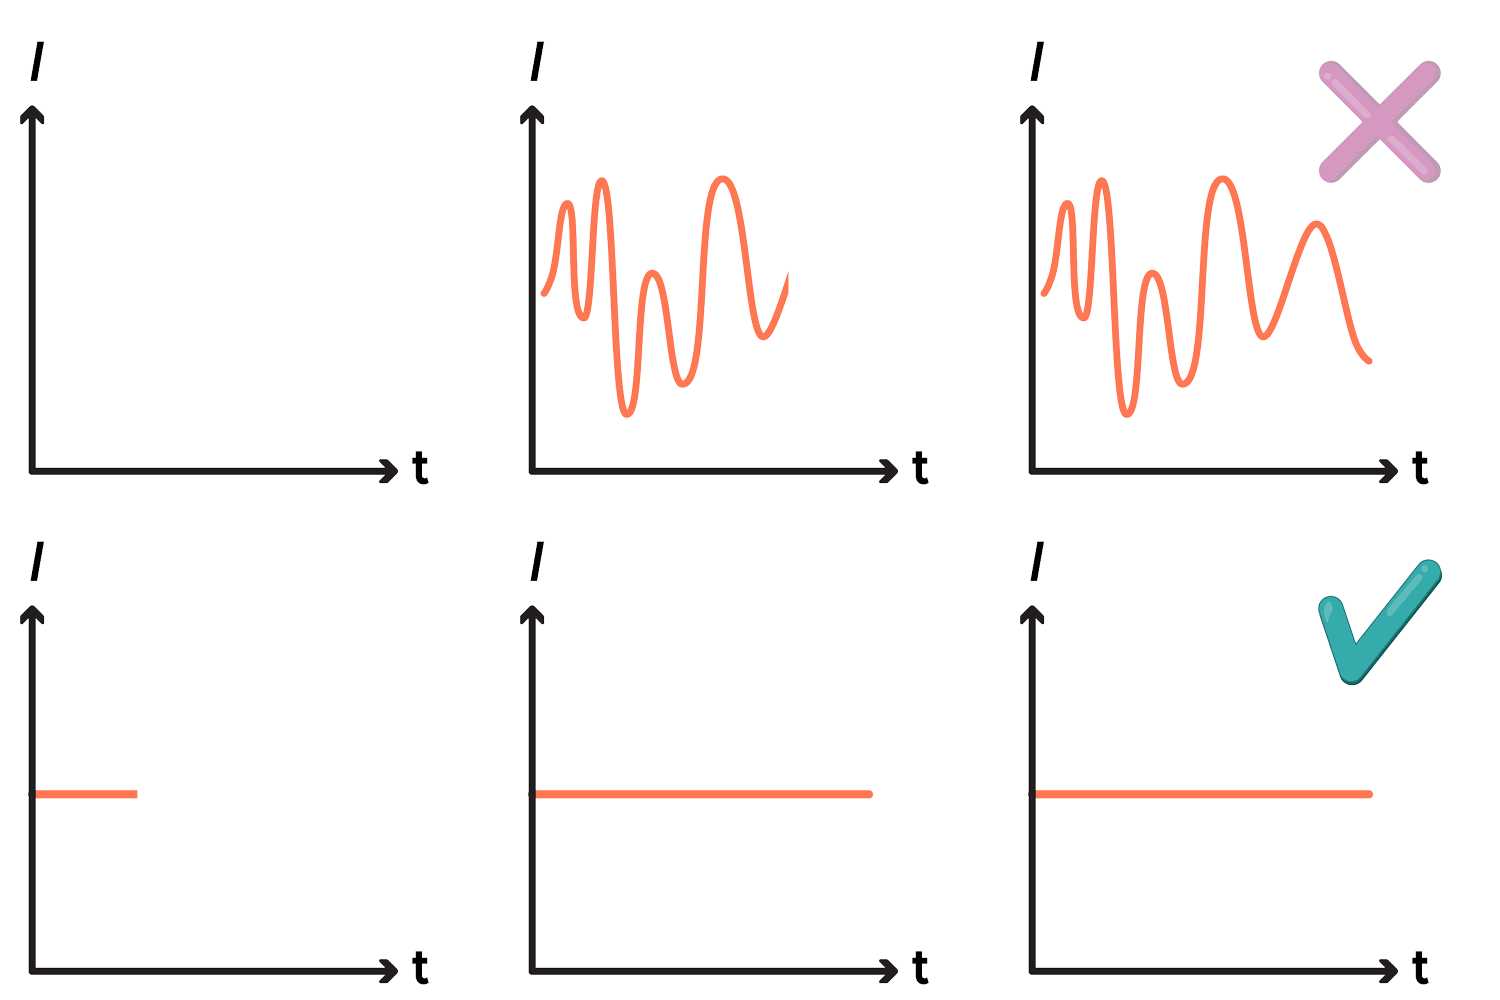
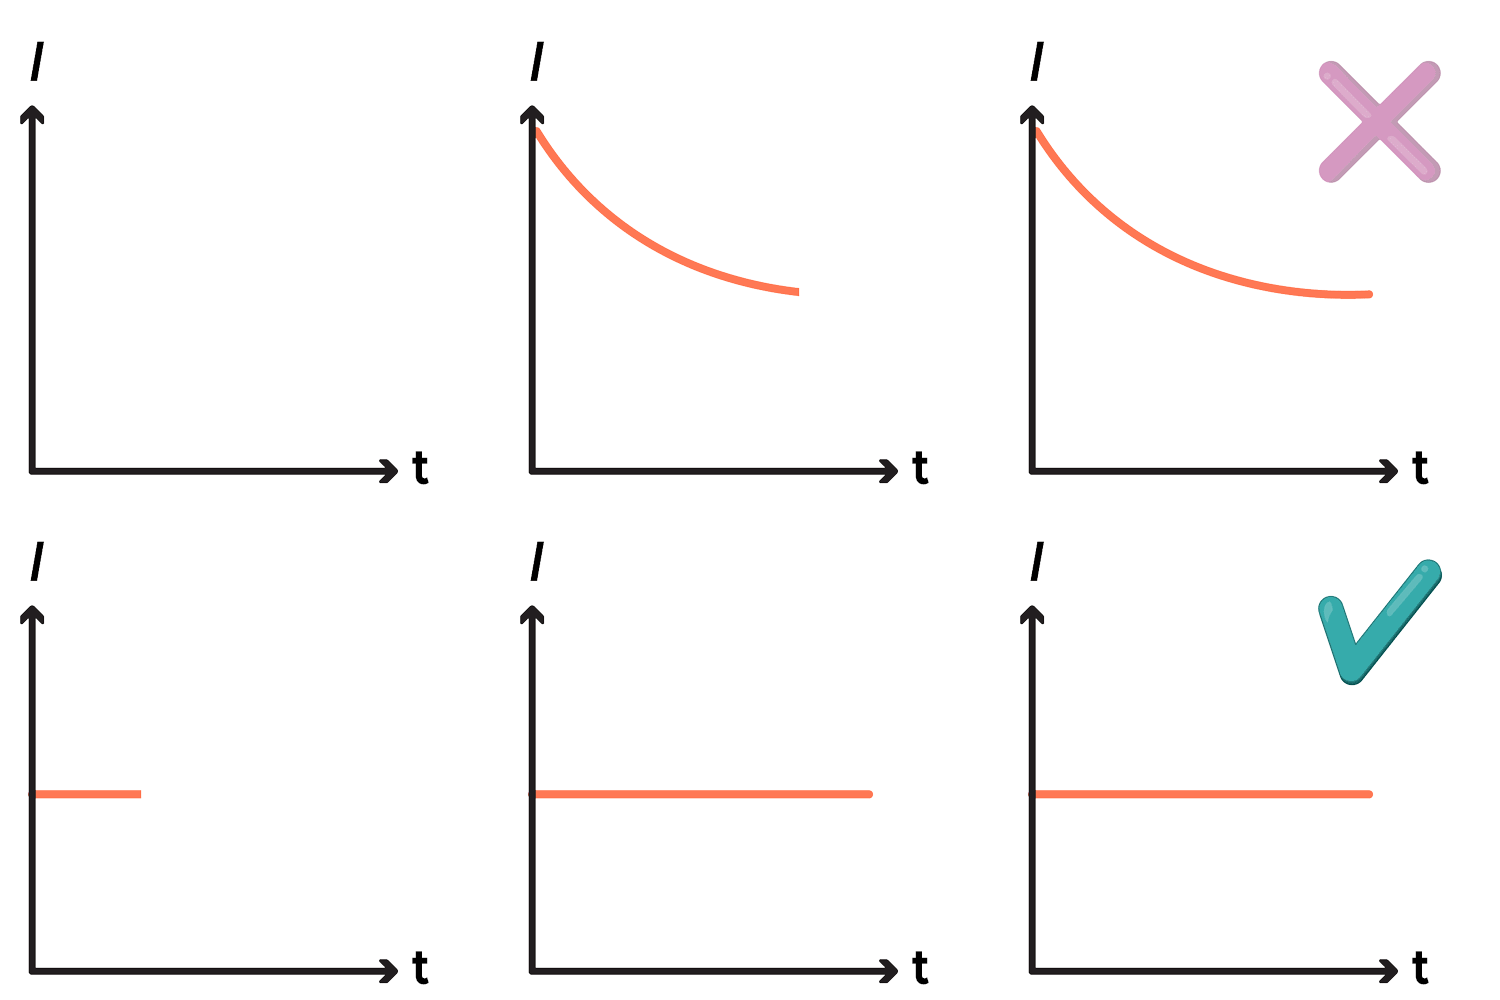
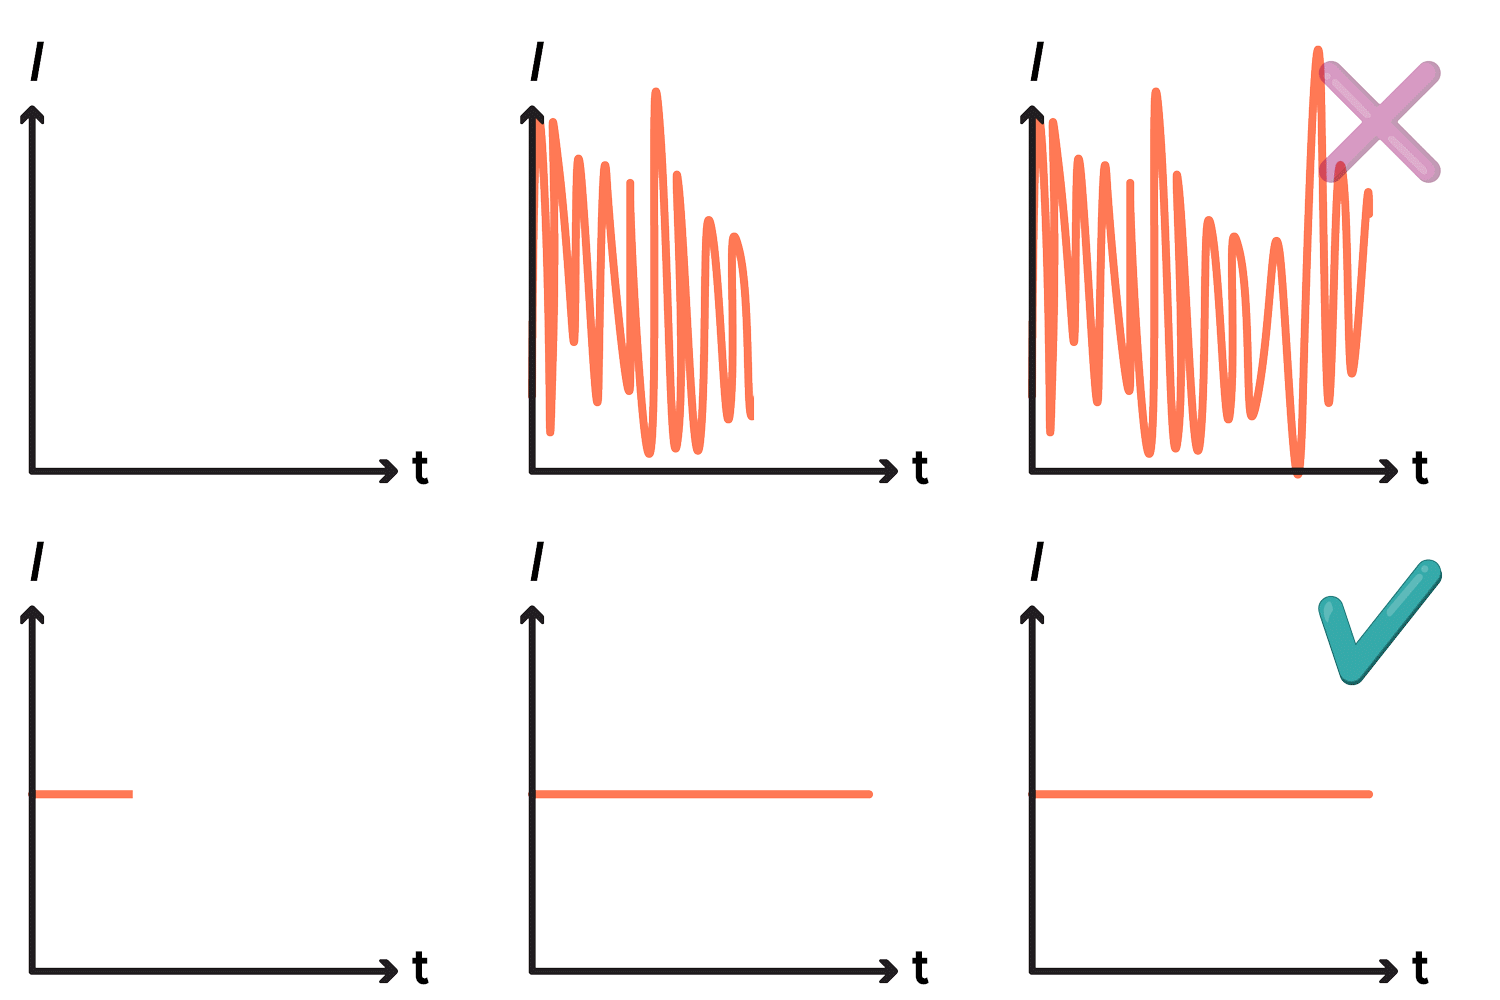
- Four conditions: linearity (response proportional to the perturbation), time invariance (the system does not change during the measurement), steady state (transients have decayed) and minimal noise (no electromagnetic interference, temperature fluctuation or loose connection).
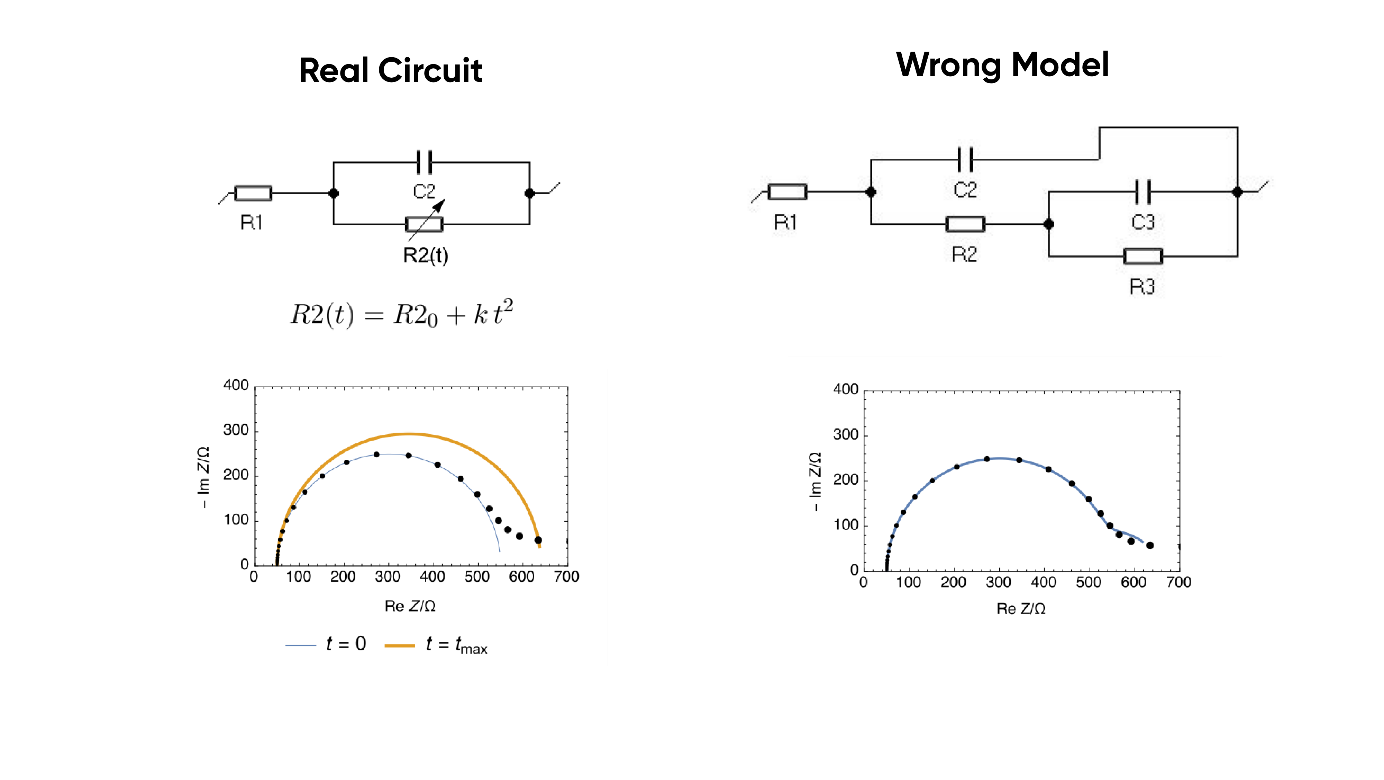
- A spectrum taken from a time-variant system can also be fitted well with a wrong equivalent circuit; in a degrading battery, for example, a change in R2(t) looks like a second time constant (Bio-Logic AN55).
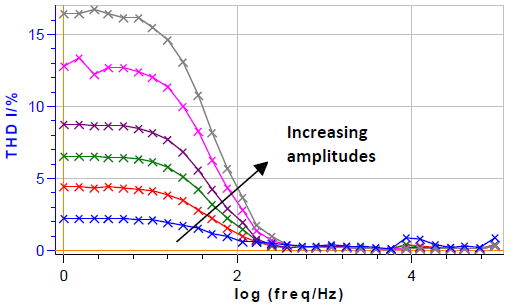
- Before adding data to a dataset: no sharp jumps in phase angle, smooth Nyquist and Bode curves, and nearly identical results from repeated measurements under the same conditions. The EC-Lab EIS QI indicators (THD, NSD, NSR) give a numerical quality label at each frequency.
- Validation methods: EIS at various amplitudes (easy to understand but time-consuming); THD (one quantitative value per frequency, requires theoretical understanding); Lissajous (visual but qualitative, needs many data at each frequency); Kramers-Kronig (tests general validity, not only linearity, but is informative only when it fails and cannot be used with incomplete Nyquist data); measurement model (easy to implement, informative only when it fails).
- Equivalent-circuit selection: some series and parallel arrangements are indistinguishable. Prefer models consistent with the literature, checked by an expert eye and pruned of unnecessary elements with the EC-Lab sensitivity factors.
- On the DC side, the proven method that gives high-quality data for lifetime prediction is high-precision coulometry (HPC).
Figures
Images: Bio-Logic Science Instruments; taken from the source article.
Related application notes
- Why is EIS misinterpreted on time-varying systems? Corrosion AN55
- What do the EIS quality indicators THD, NSD and NSR tell us? Corrosion AN64
- Which parameters affect the THD value, and how does it compare with other linearity tests? Corrosion AN65
- How do Kramers-Kronig transforms test the consistency of my EIS data? Battery AN15
- How are precision and accuracy ensured in Coulombic-efficiency measurement (HPC)? Battery AN53
Related curriculum module: Electrochemical Impedance Spectroscopy (EIS)
Source: Bio-Logic Learning Center, “Collecting High-Quality EIS Data for AI Training” · Source updated: July 11, 2025
Copyright of the images and the original text belongs to Bio-Logic SAS.
Copyright of the images and the original text belongs to Bio-Logic SAS.