
Bio-LogicBio-Logic Science Instruments Authorized Distributor for Türkiye
+90 (312) 437 40 77  ·  [email protected]
TR/EN
Get a Quote
Popular topics · Modelling and fitting (ZFit, ZSim)

How does the standard error (std err.) in ZFit show how far I can trust a fitted parameter?

χ² gives the overall quality of a fit; confidence in each parameter is given by its standard error. How the Monte Carlo standard error behaves with noise, over-complex models and incomplete data.

Key points

  • The standard error measures the uncertainty arising from measurement errors (random and systematic), an inadequate equivalent circuit or an unsuccessful minimisation.
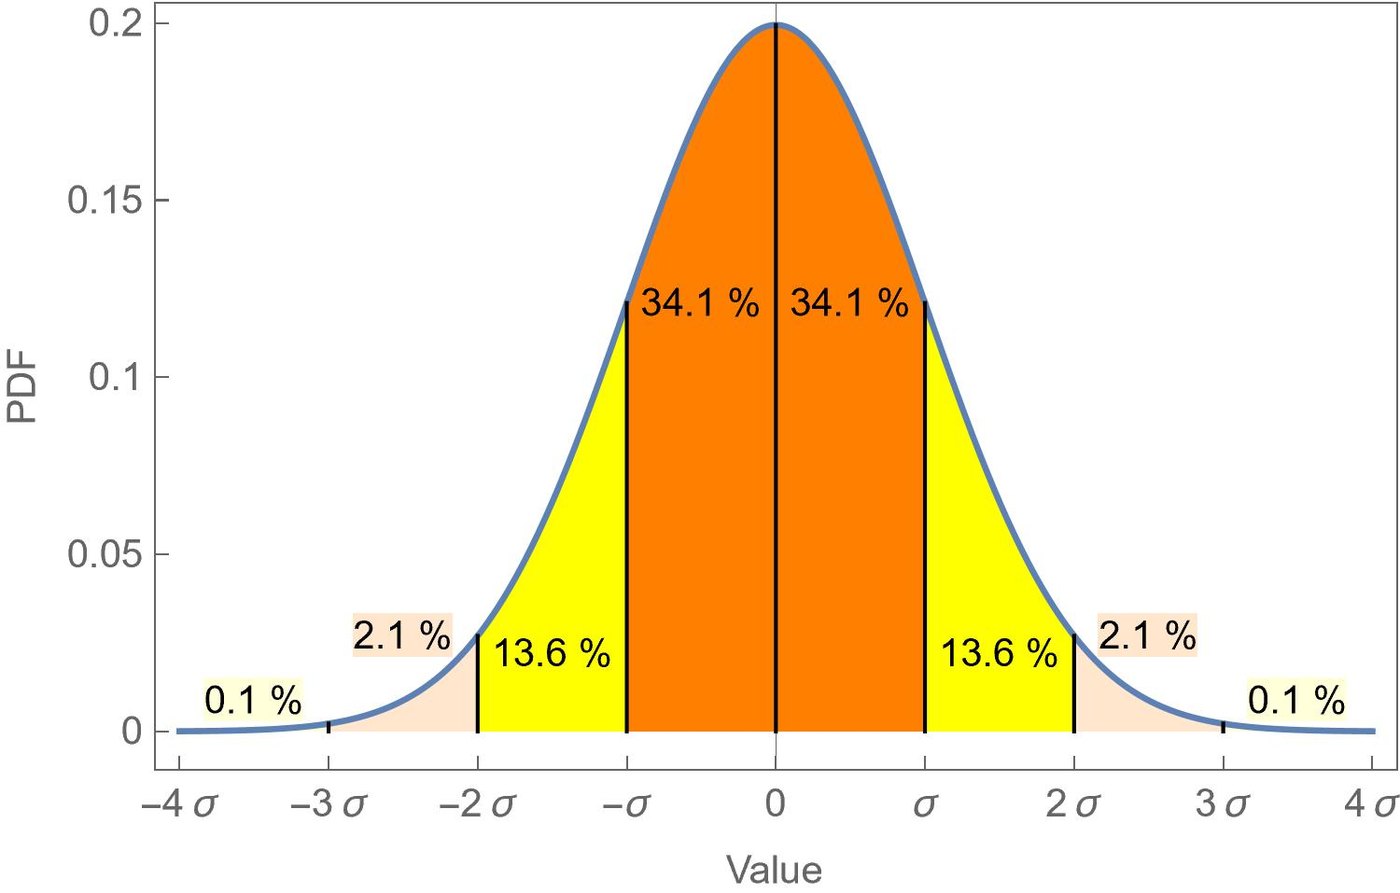
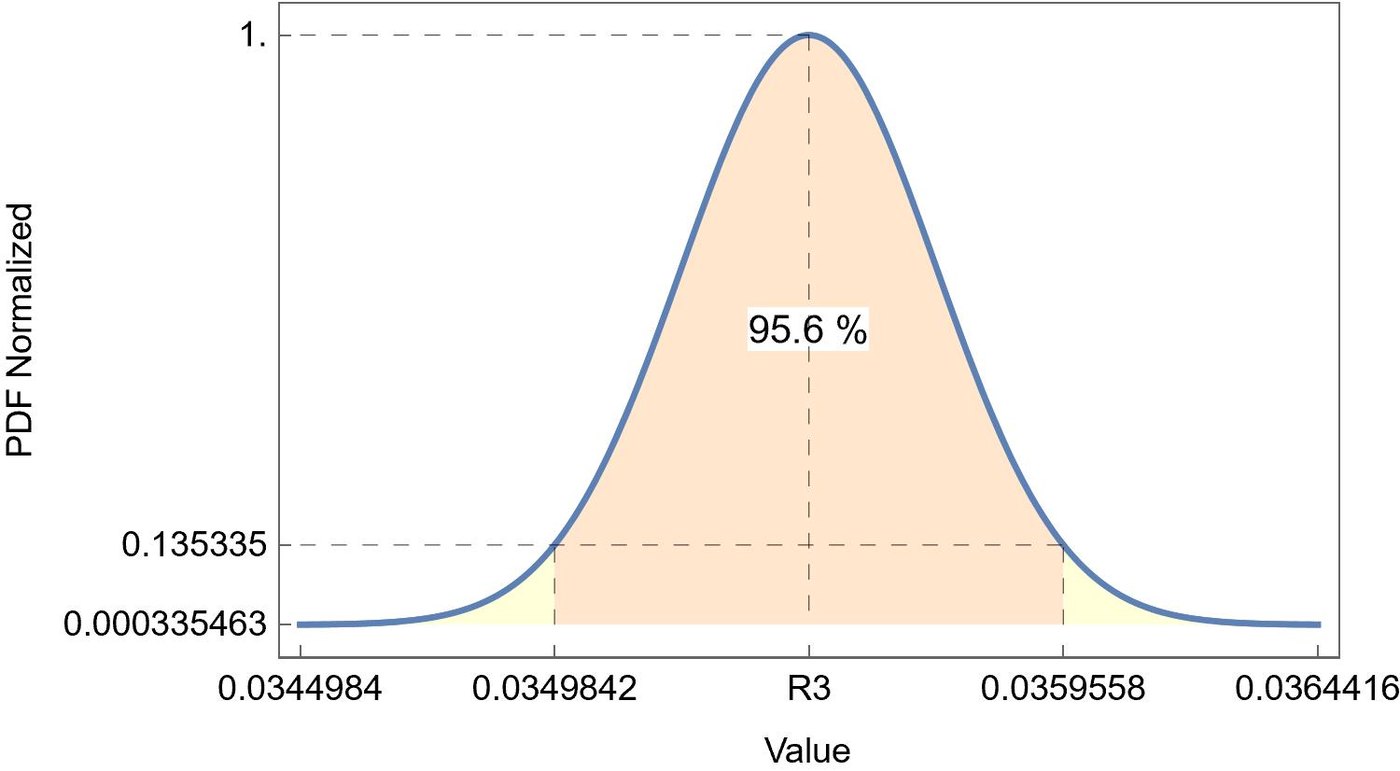
  • Assuming a normal distribution, the ±2σ interval (coverage factor k = 2) carries about 95% probability; the confidence (coverage) interval is calculated from it.
  • Since EC-Lab 11.50 an adapted Monte Carlo method after Alper and Gelb is used: new data sets are generated from the residuals of the first fit, each is fitted again and the standard error is obtained from the distribution of parameter values.
  • As noise increases, not only precision (the confidence interval) but also accuracy degrades; fitted values move away from the true value.
  • Parameters whose standard error is equal to or larger than their value are meaningless and indicate an over-complex model. In the example, removing these elements increases χ²/|Z|² only slightly, and the two simplified models are indistinguishable.
  • With incomplete (truncated) data the parameter values remain correct for a while as the standard error grows rapidly; the standard error is a more sensitive warning of missing data.

Figures
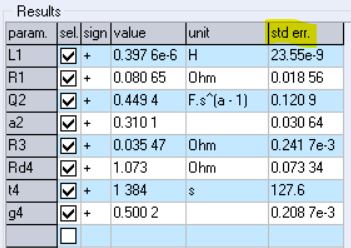
In ZFit results each parameter has a standard error (std err.) column.
Figure 1. In ZFit results each parameter has a standard error (std err.) column.
Normal distribution: the ±σ interval covers 68.2%, the ±2σ interval about 95% probability.
Figure 2. Normal distribution: the ±σ interval covers 68.2%, the ±2σ interval about 95% probability.
95.6% confidence (coverage) interval for R3 with coverage factor k = 2.
Figure 3. 95.6% confidence (coverage) interval for R3 with coverage factor k = 2.
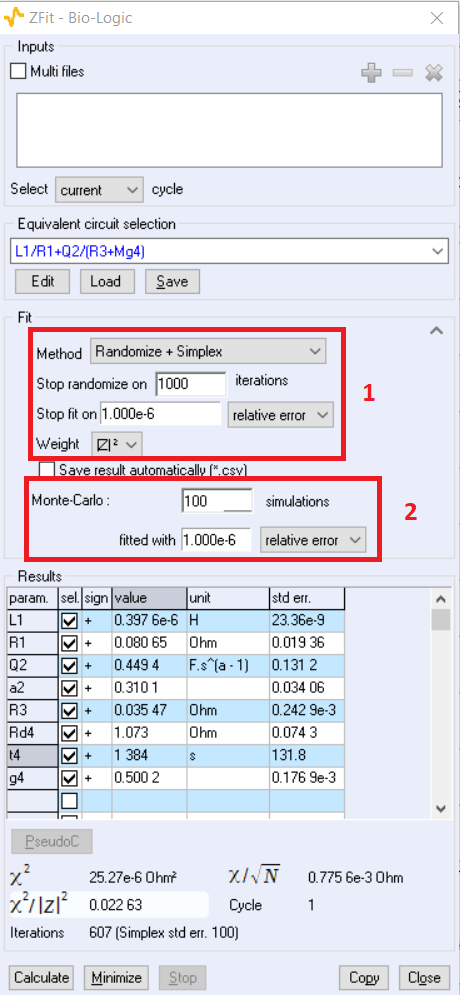
ZFit settings: (1) Randomize + Simplex minimisation and stop criteria, (2) number of Monte Carlo simulations for the standard error.
Figure 4. ZFit settings: (1) Randomize + Simplex minimisation and stop criteria, (2) number of Monte Carlo simulations for the standard error.
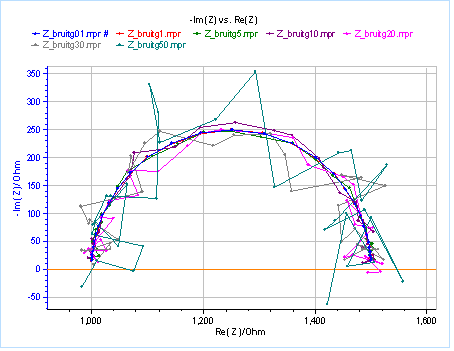
Seven data sets generated from an R1 + R2/C2 circuit with increasing Gaussian noise.
Figure 5. Seven data sets generated from an R1 + R2/C2 circuit with increasing Gaussian noise.
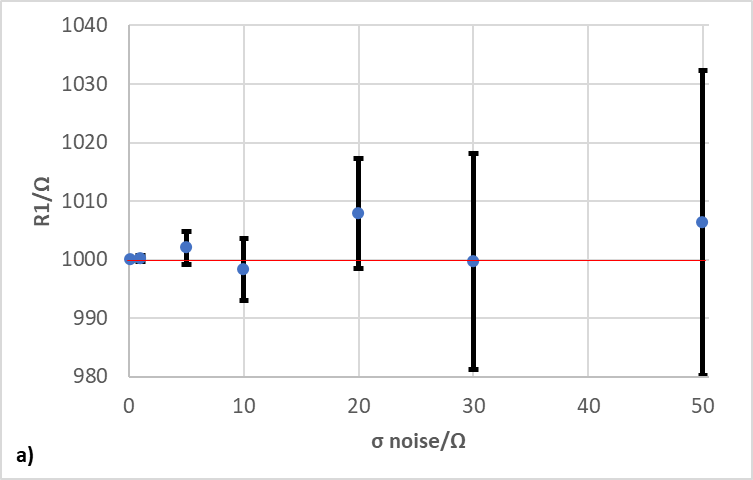
As noise increases the 95% confidence interval of R1 widens and the fitted value moves away from the true value (1000 Ω).
Figure 6. As noise increases the 95% confidence interval of R1 widens and the fitted value moves away from the true value (1000 Ω).
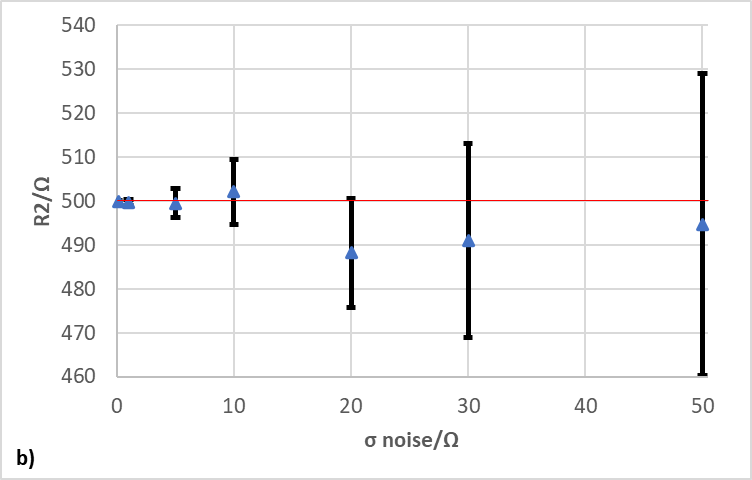
Same trend for R2: noise degrades both precision and accuracy (true value 500 Ω).
Figure 7. Same trend for R2: noise degrades both precision and accuracy (true value 500 Ω).
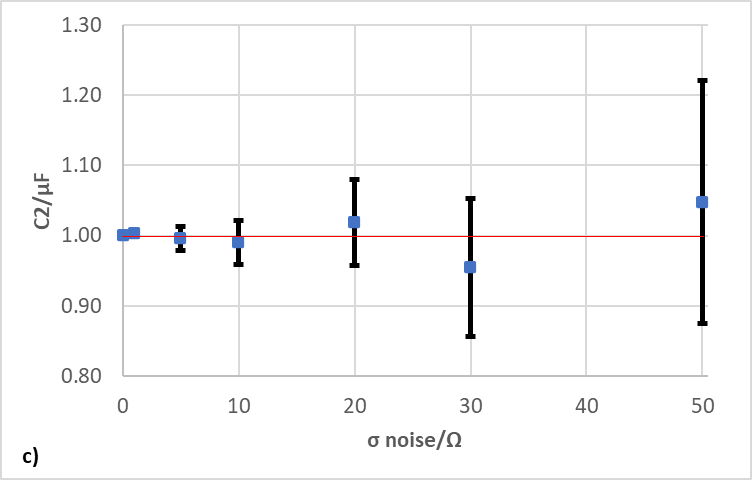
Same trend for C2 (true value 1 µF).
Figure 8. Same trend for C2 (true value 1 µF).
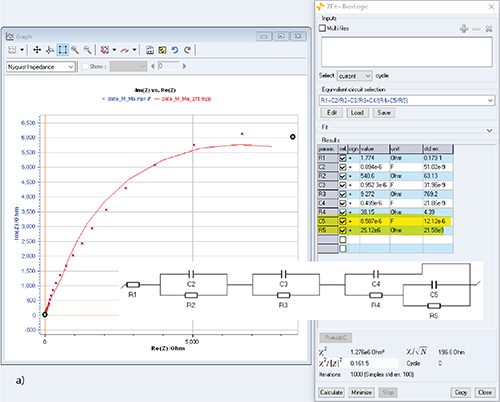
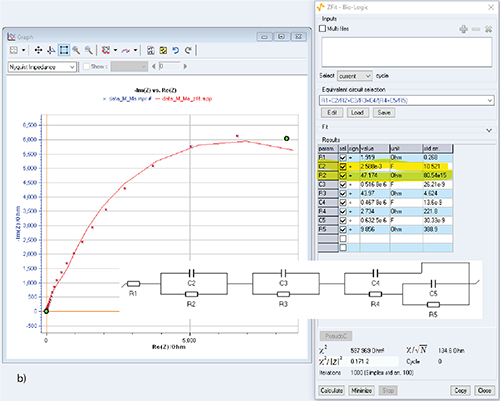
Fit with a four-time-constant circuit: standard errors of R5 and C5 exceed their values, so these elements are meaningless.
Figure 9. Fit with a four-time-constant circuit: standard errors of R5 and C5 exceed their values, so these elements are meaningless.
Another fit of the same data: this time R2 and C2 come out meaningless; the model is over-complex.
Figure 10. Another fit of the same data: this time R2 and C2 come out meaningless; the model is over-complex.
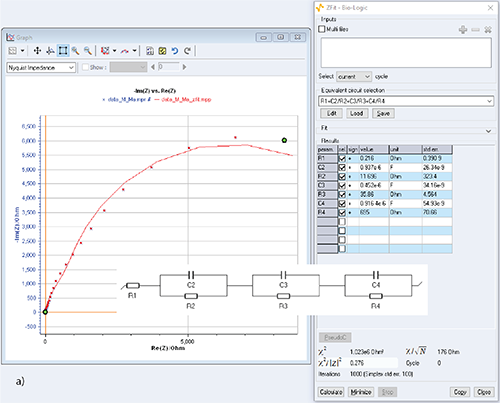
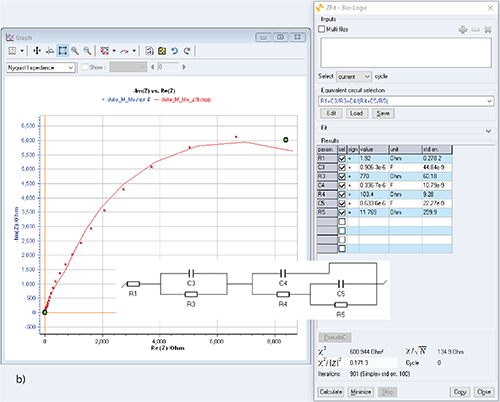
With R5 and C5 removed all standard errors are smaller than the values; χ²/|Z|² increases only slightly.
Figure 11. With R5 and C5 removed all standard errors are smaller than the values; χ²/|Z|² increases only slightly.
Removing R2 and C2 also gives a meaningful fit; the two simplified models are indistinguishable.
Figure 12. Removing R2 and C2 also gives a meaningful fit; the two simplified models are indistinguishable.
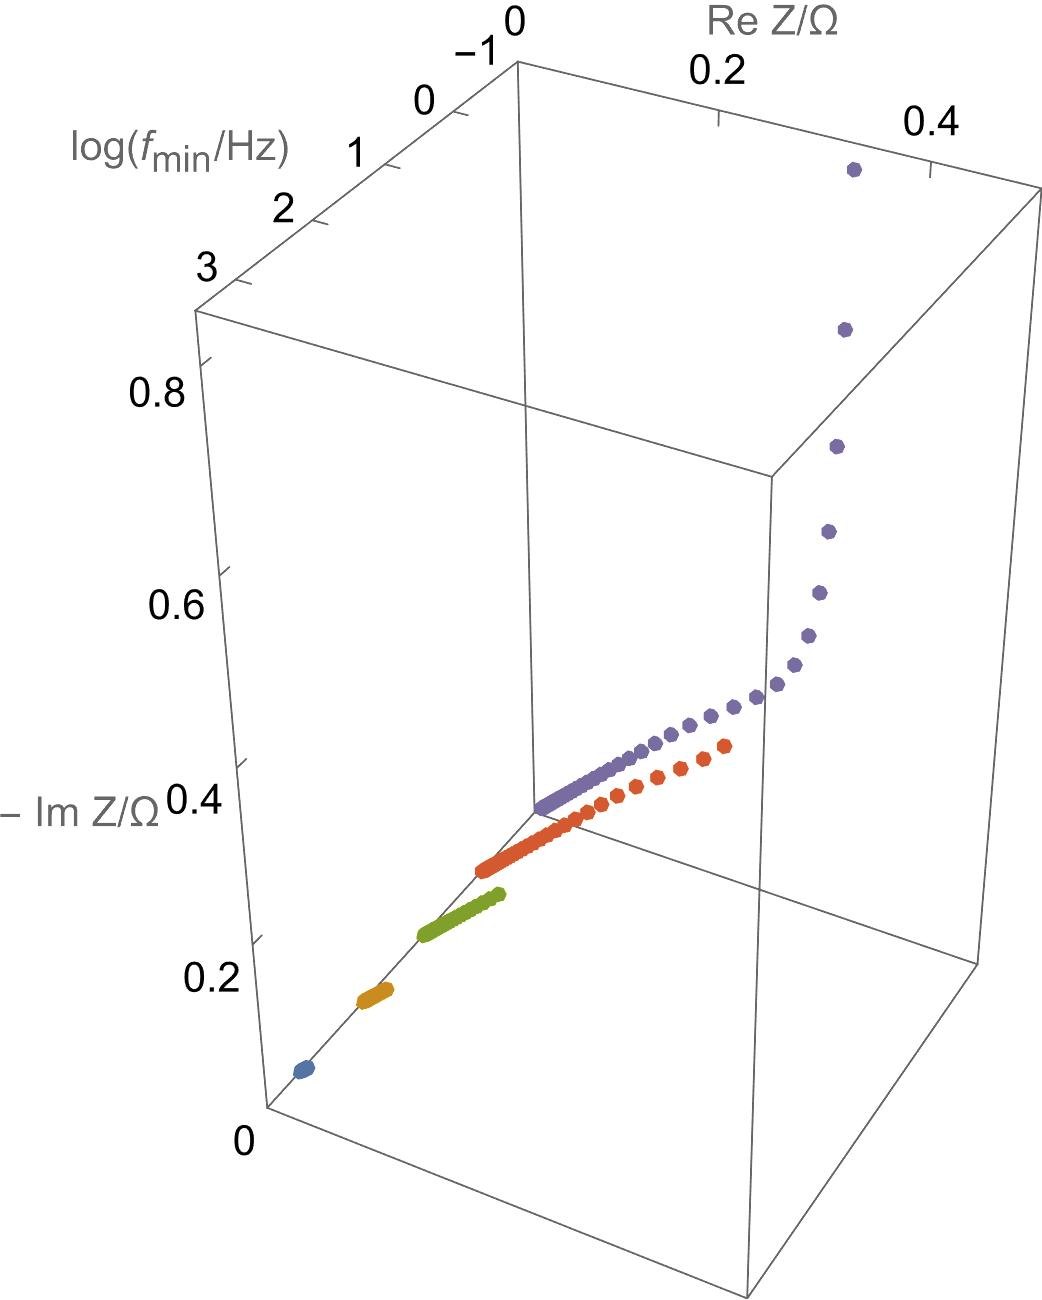
Five spectra of the M element (restricted diffusion) truncated by increasing the minimum frequency.
Figure 13. Five spectra of the M element (restricted diffusion) truncated by increasing the minimum frequency.
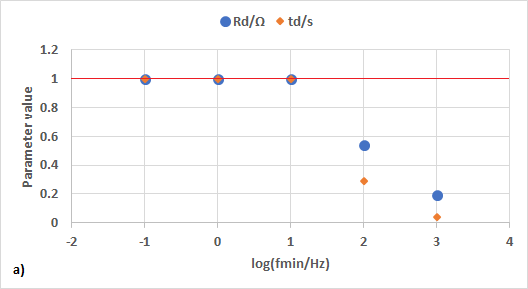
Rd and τd are found correctly even when data are truncated by two decades (fmin = 10 Hz); with more truncation they deviate.
Figure 14. Rd and τd are found correctly even when data are truncated by two decades (fmin = 10 Hz); with more truncation they deviate.
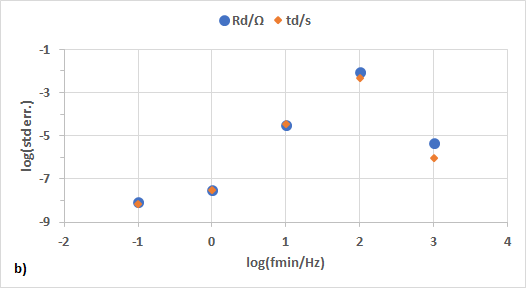
The standard error is far more sensitive to incomplete data than the parameter value: at fmin = 10 Hz, while the parameters are still correct, it rises by more than three orders of magnitude.
Figure 15. The standard error is far more sensitive to incomplete data than the parameter value: at fmin = 10 Hz, while the parameters are still correct, it rises by more than three orders of magnitude.

Images: Bio-Logic Science Instruments; taken from the source article.

Related application notes

Related curriculum module: Electrochemical Impedance Spectroscopy (EIS)

Related products:EC-Lab®BT-Lab® Suite
Source: Bio-Logic Learning Center, “ZFit: How to have confidence in results using std err.?” · Source updated: November 18, 2024
Copyright of the images and the original text belongs to Bio-Logic SAS.

All popular topics

Would you like to set up this measurement in your laboratory?

Contact our technical team for the suitable instrument, cell and software configuration.

Quotation and technical consulting